1. Overview & The Brief
As e-commerce operations scaled, the client required a centralized, highly responsive web-based Order Assistant to handle high data density without overwhelming warehouse staff. The objective was to design and develop a unified B2B dashboard—bridging Figma concepts into a functional, modular front-end architecture—to drastically reduce order processing times.

2. The Context
E-commerce managers were relying on disjointed, manual spreadsheets to track orders, inventory, and customer data. This lack of a centralized system led to operational bottlenecks, data entry errors, and a poor overview of business metrics.
I designed a centralized web application that consolidates complex data sets into an actionable, user-friendly interface. By prioritizing data hierarchy and clear data visualization, the app reduces cognitive load and allows managers to process orders efficiently.

3. Ideation & Architecture
The transition from a raw data spreadsheet to a functional UI required rigorous mapping. I started with foundational sketching to establish the user flow, followed by low-fidelity wireframes to test layout logic before committing to pixel-perfect designs.
Data Hierarchy Mapping
Deconstructed disjointed spreadsheets to group related fields (orders, inventory, customer details) into structured modules.
Friction Reduction
Mapped paths to ensure e-commerce managers could perform primary tasks (approving dispatch, handling complaints) in under three clicks.
Density Control
Created low-fidelity structures to validate complex data tables and layouts without overwhelming warehouse operators.
Live Design System Component
B2B Order Grid Demo| Order ID | Customer | Date | Status | Amount | Action |
|---|---|---|---|---|---|
| 210001656 | Chehili Mehdi | 01-Dec-2021 | Commande Validée | 21,245 DA | |
| 210001657 | Mekideche Foudil | 01-Dec-2021 | Commande Validée | 6,200 DA | |
| 210001658 | Leghrib Yassine | 01-Dec-2021 | Réclamation | 10,245 DA | |
| 210001659 | Bahlouli Sami | 01-Dec-2021 | En Cours | 2,657 DA |
4. Establishing the Visual Language
To ensure scalability, we developed a modular design system. The color palette utilizes semantic signals and distinct status indicators to provide instant feedback for user management. The typography prioritizes readability for high information density.
Semantic Coding System
Click any color block to copy its hex value.
Scale & Alignment
Prioritized text hierarchy for dynamic viewport densities.
Component Library
Atomic components with precise semantic signals.
5. Final UI & Key Features
The Command Center
A top-level overview providing instant visibility into key performance indicators, recent orders, and revenue charts.
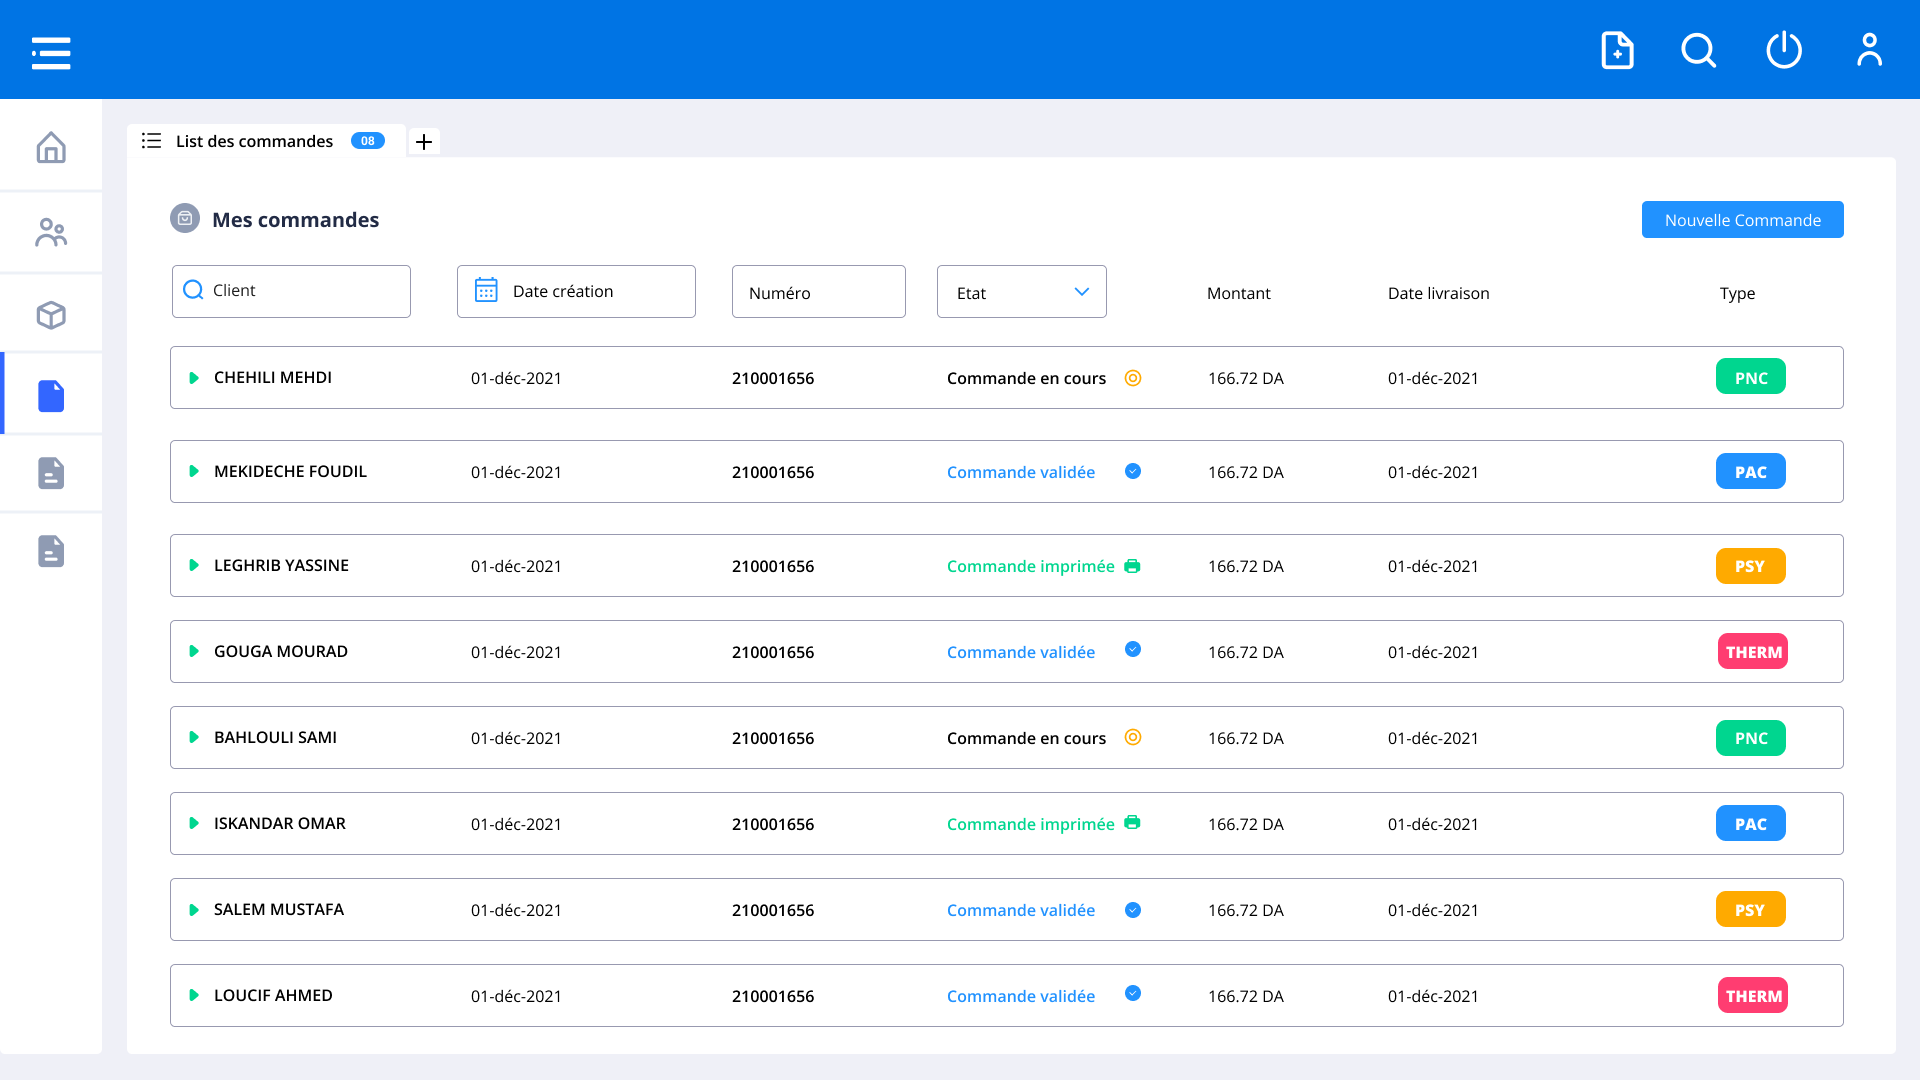
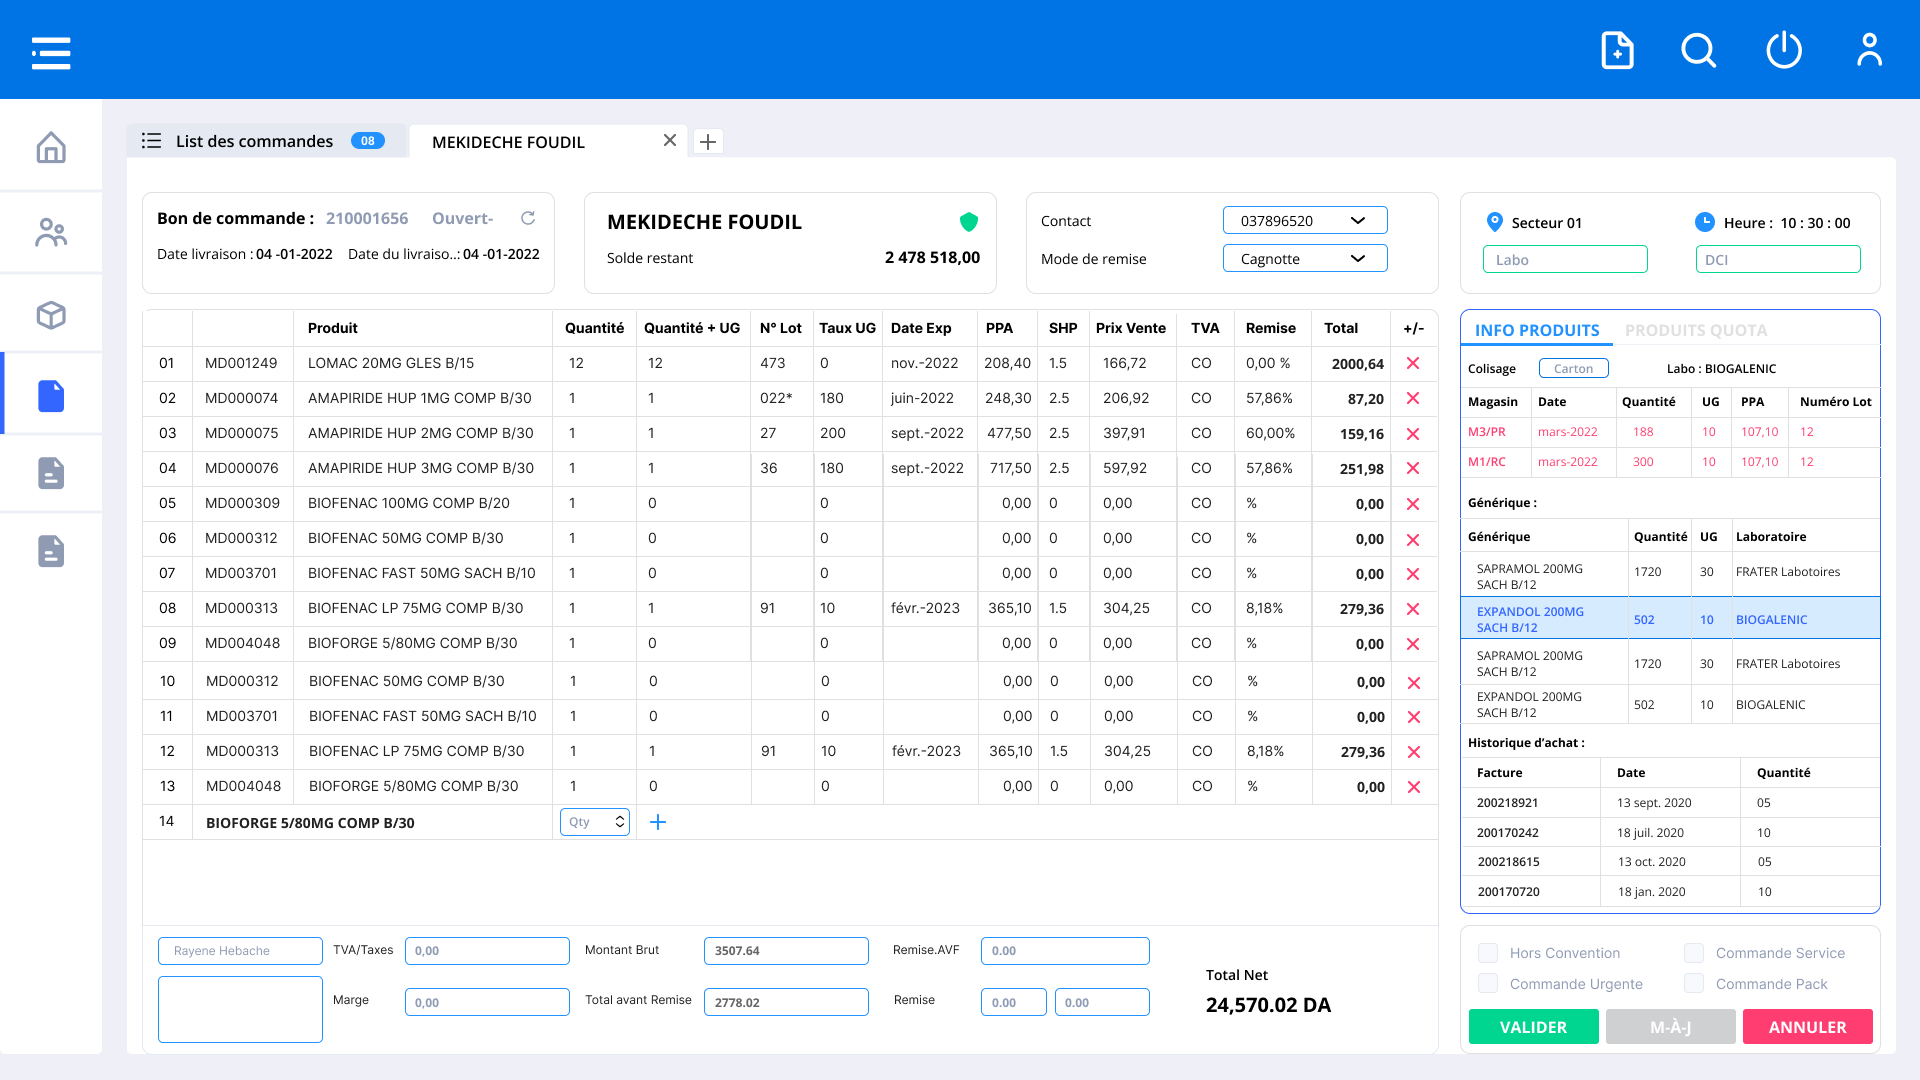
Streamlined Order Management
Complex data tables redesigned with clear typography, intuitive filtering, and bulk-action capabilities to accelerate daily workflows.
Analytics & Reporting
Visualized data modules that allow stakeholders to quickly assess business health without parsing through raw numbers.
High-Fidelity Interface Showcase
Explore 5 desktop screens from the Order Assistant enterprise dashboard. Architected with high information density, strict layout modularity, and optimized tabular interfaces to speed up fulfillment cycles.
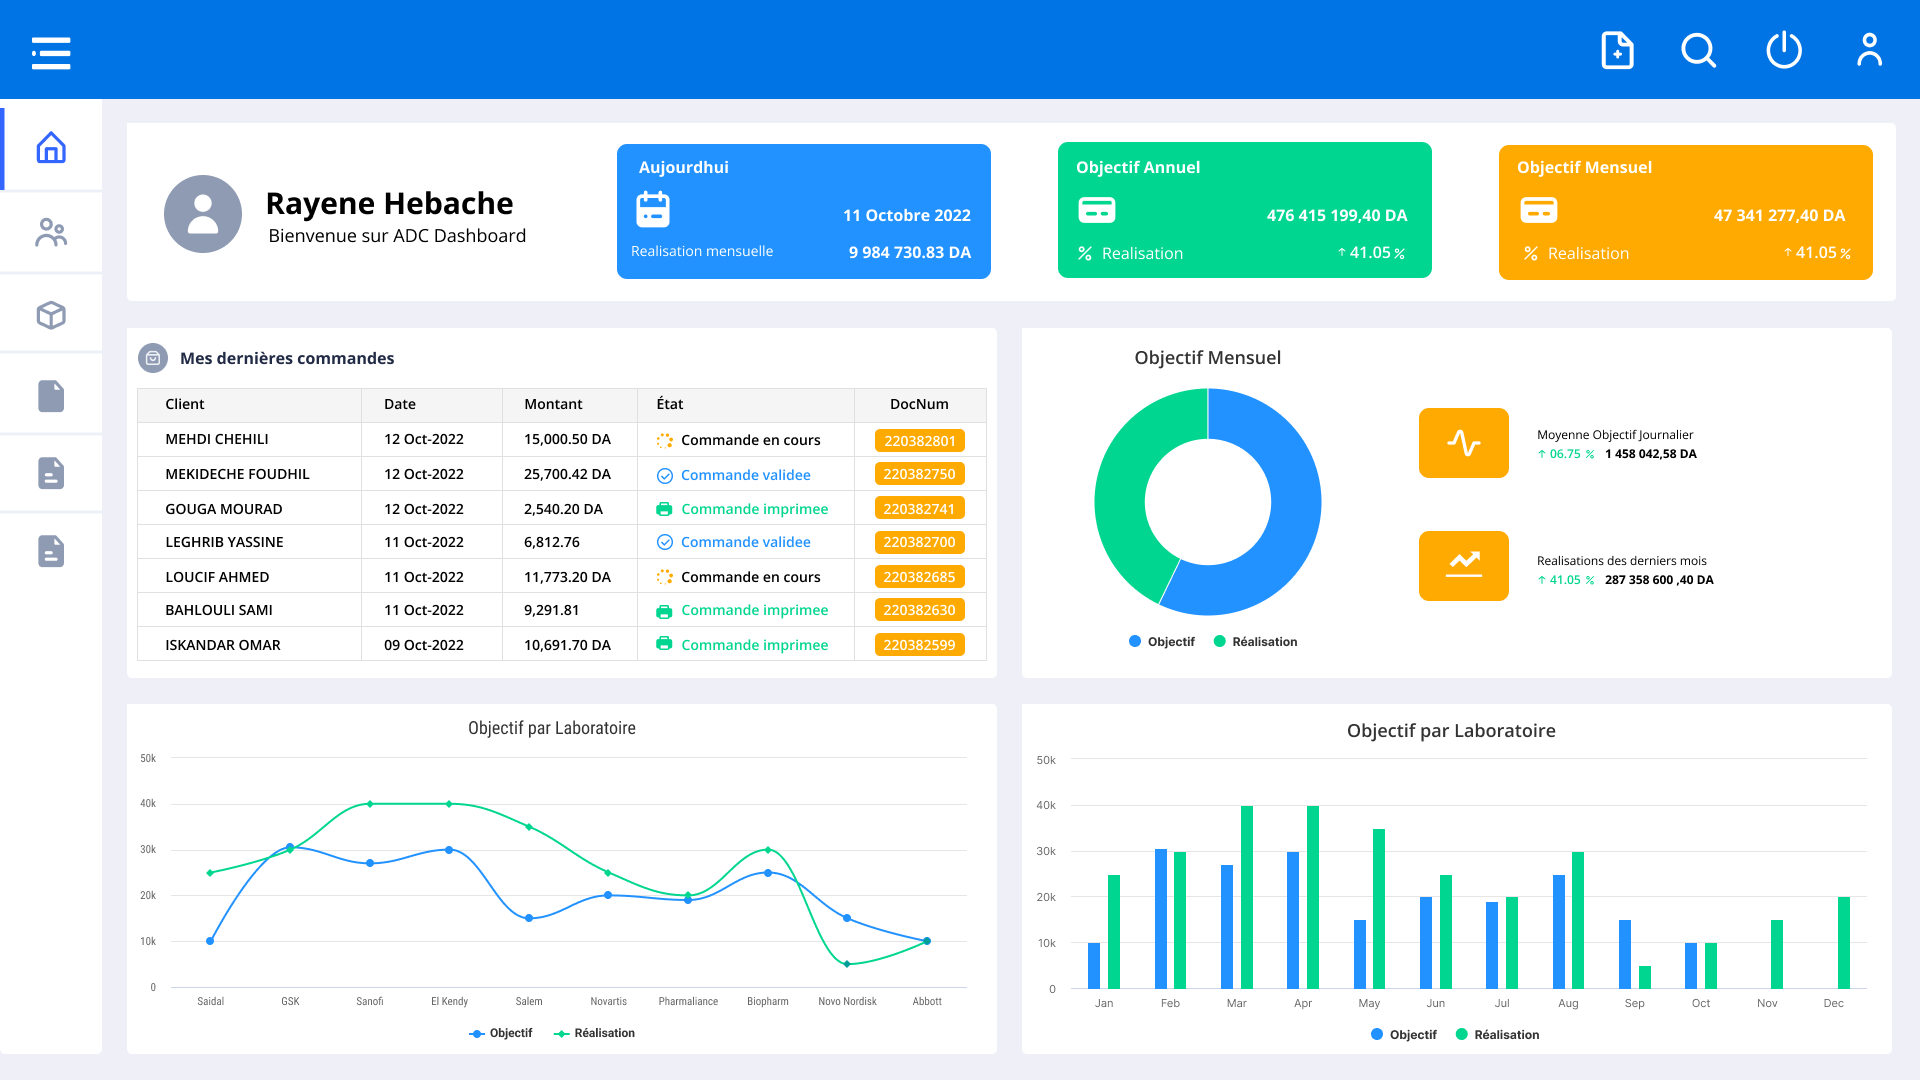
Command Center Dashboard
Active Shipments Panel
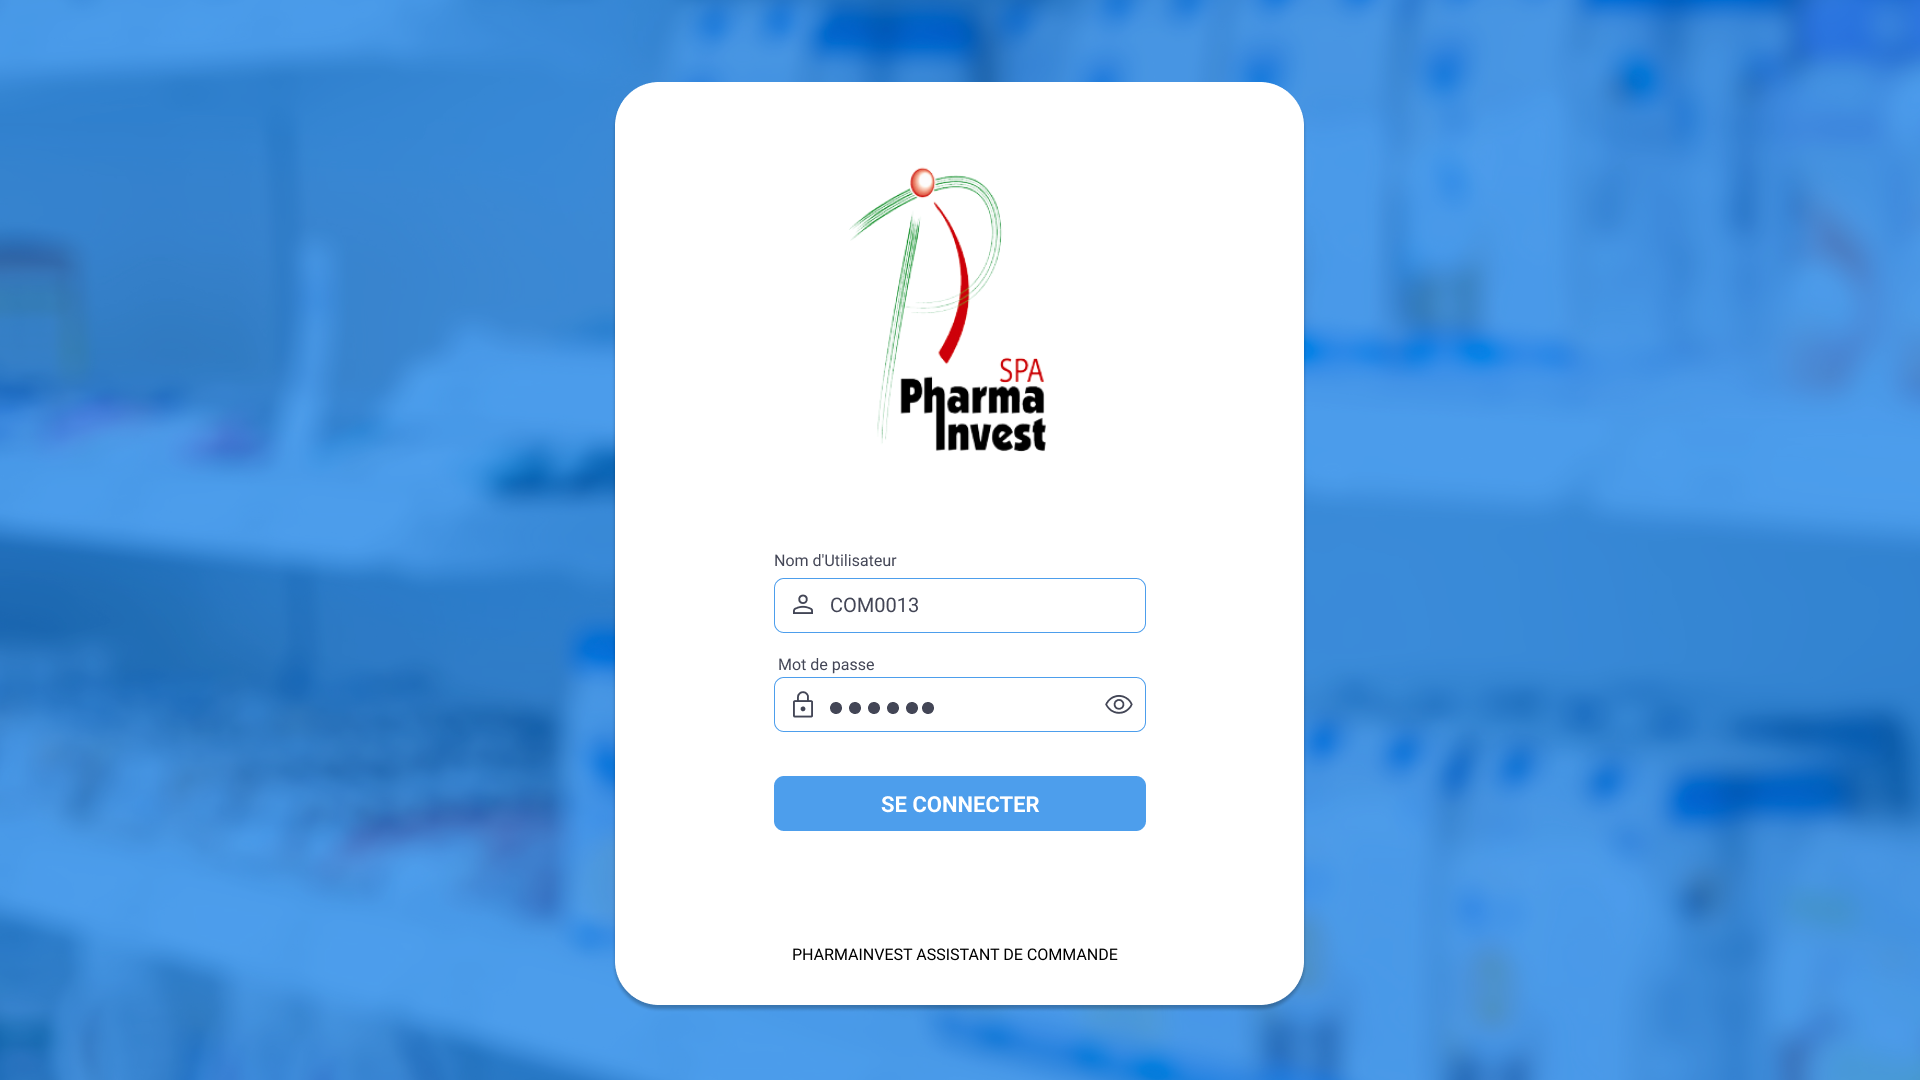
Security Entry Gateway
Order Pipeline Management
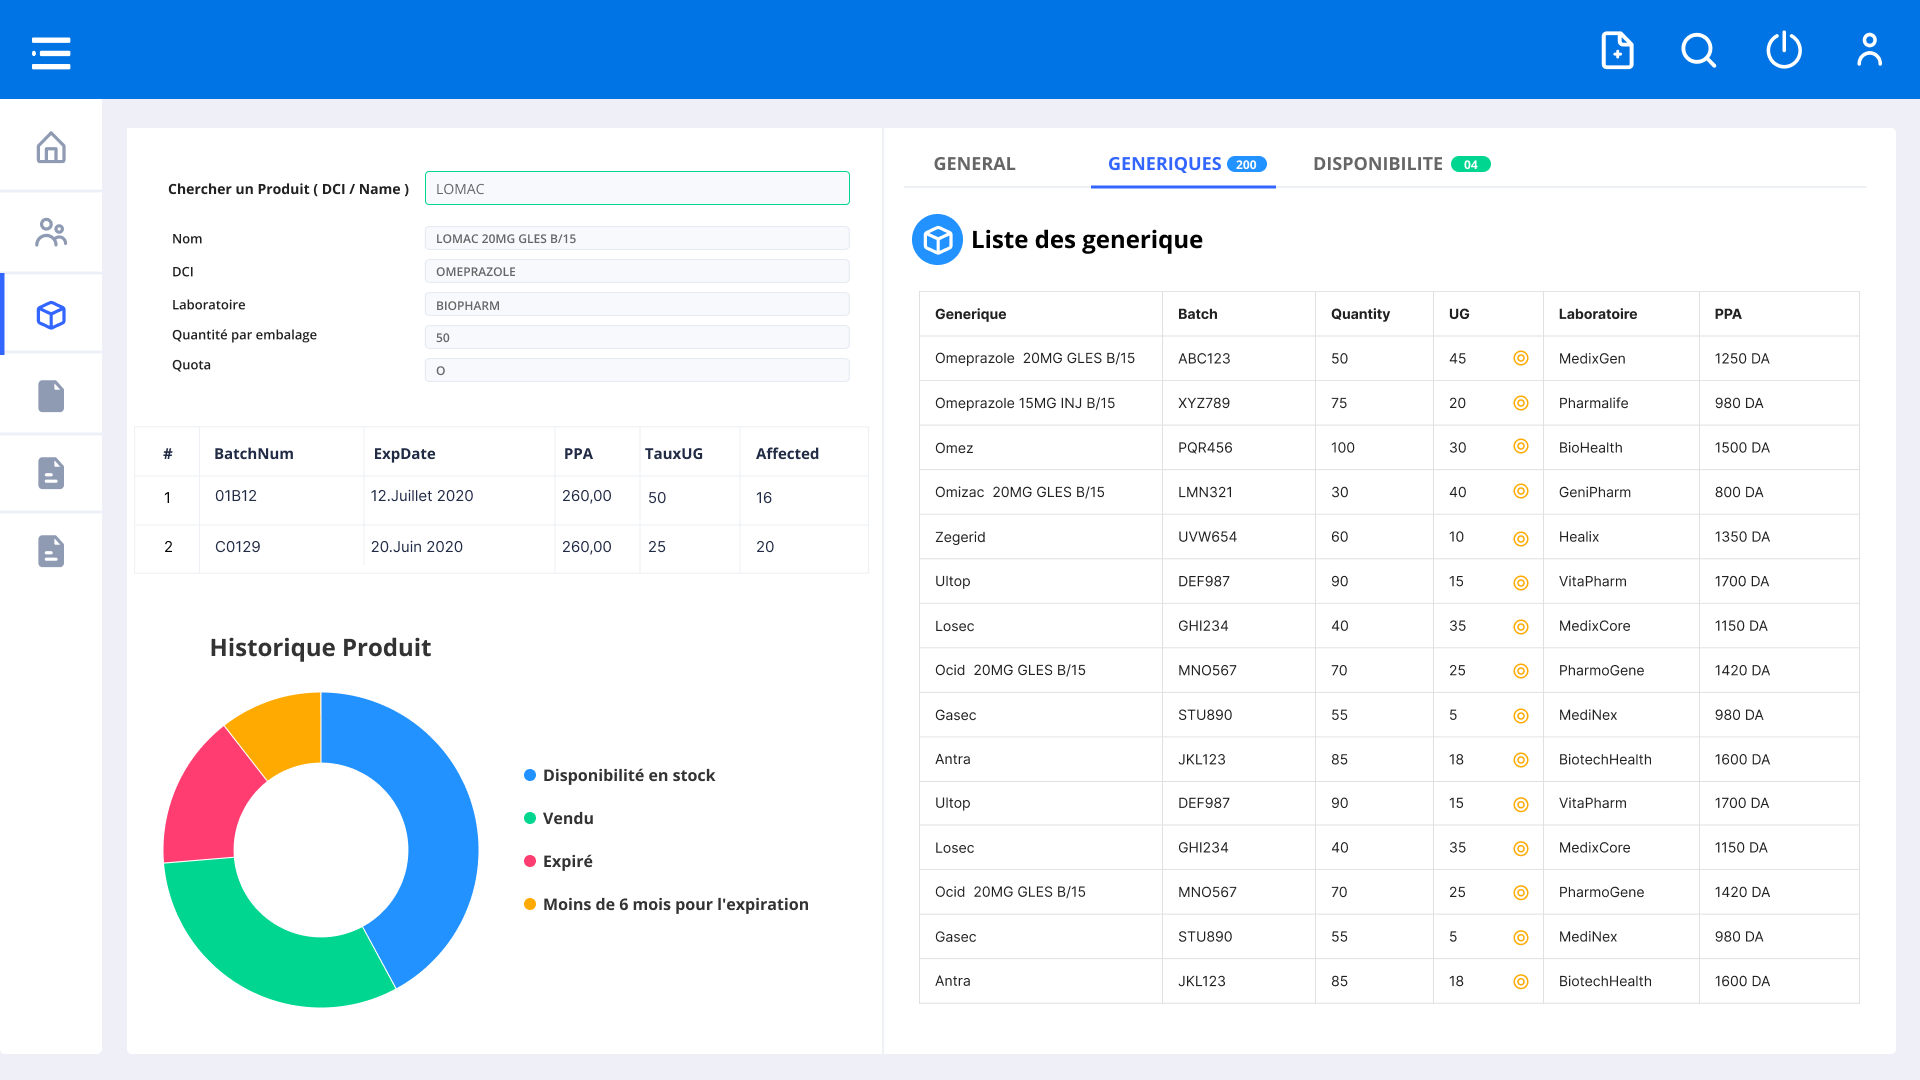
Catalog & Stock Inventory
6. Project Impact & Reflection
This project was a deep dive into taming complex data. It reinforced the importance of function-first design—proving that enterprise tools don't have to be visually overwhelming to be powerful. By focusing on user workflows over purely aesthetic choices, the resulting application drastically reduced the time required to manage daily e-commerce operations.
More Projects
View All Projects →That Dubai Girl
Designed and developed two cohesive digital platforms that reflect the brand's overarching sisterhood while allowing each city its own distinct identity.